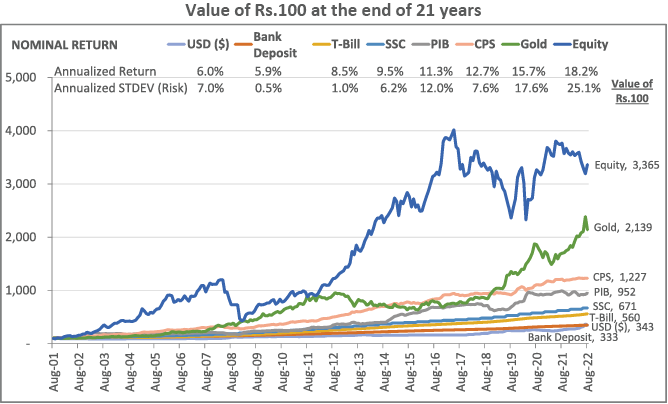
The last five years or so have been challenging for the stock market as it has fallen by 22% from its peak hit on May 24, 2017 of 52,876 points. This subdued performance of the stock market has come after a phenomenal run posted after the 2008 financial crisis, where the KSE-100 Index surged by around 1000% over the next 8 years. Looking at the long-term performance of the stock market, it is evident that such periods with depressed returns do not stay forever. In the long run, stocks have outperformed all other asset classes, although it is volatile in the short-term. Historical market data cannot predict the future but it is still a useful guide to understand the potential risks and rewards for investors. With that in mind, we examine past performance of key domestic asset classes for a 21-year period from September 2001 to August 2022. We have included seven asset categories for which long-term data is available: Treasury Bills, Bank Deposits, National Savings Schemes (NSS), Pakistan Investment Bonds (PIBs), Stocks, US Dollar and Gold. Inflation, as measured by CPI, has averaged 9.4% per annum, and Pak Rupee has depreciated against the US Dollar by 6.0% per year over the last twenty-one years.
The historical analysis, as given in the Table below depicts that stocks offered the highest nominal and real return amongst all asset classes. An investment of PKR 100 in stocks in September 2001 would be worth PKR 3,365 by the end of August 2022. During the same period, PKR 100 investment in bank deposits and T-Bills would have increased to a paltry PKR 333 and PKR 560, respectively.
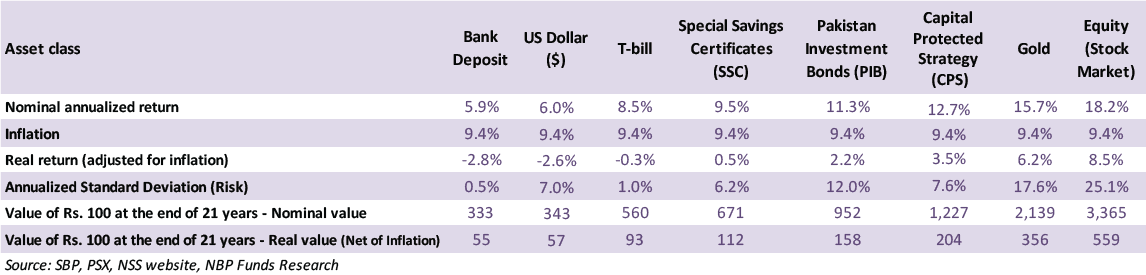
The outcome of the above analysis supports the basic notion that there is a positive relationship between risk and return, meaning higher the risk the higher the return. In line with the expectation, stocks exhibited the highest volatility, and bank deposits and T-Bills have the lowest risk. The analysis also shows that over a long investment horizon, stocks delivered the highest return.
One take away from this analysis is that investors with long-term goals like educating their children, owning a house, or saving for retirement should have some of their assets invested in stocks, preferably through stock mutual funds, while investors with low-risk appetite and for short term investment needs, should invest in bank deposit or in money market / income funds.
Investment Outlook: Dismal performance of the market over the last five years and challenging economic situation have shaken the investors’ confidence as manifested by a large 64% contraction in the Price-to-Earnings multiple from 11.4x at the market peak in May 2017 to the prevailing level of 4.1x. Resumption of IMF program along with attractive valuations is expected to support market recovery, though the devastation caused by the floods and its implications on external account may keep market gains in check. The IMF projects improvement in current account and a resultant increase in FX reserves, aided by inflows from friendly countries. Historically, improvement in FX reserves has led to improved market sentiments and hence better stock market returns. From a fundamental perspective, the market is trading at an attractive Price-to-Earnings (P/E) multiple of 4.1x, versus historical average of 8.2x. The market also offers a healthy 7%-8% dividend yield. The recently announced corporate results have also shown strong double-digit growth, despite imposition of 10% super-tax.
Investors with medium to long-term investment horizon are advised to invest in the stock market via our NBP Stock Funds to capture attractive valuations, whereas risk averse investors can benefit from the high interest rate environment via our NBP Savings Funds.